
Five Myths about Measuring Developer Experience
This post appeared first in my Substack: flowlabs.substack.com. Sign-up there.
You rolled out AI tools, added a dashboard, and still can’t answer whether any of it made your developers’ lives better or improved outcomes. The gap usually isn’t your tooling. It’s that the things easiest to measure aren’t the things that matter, and more numbers haven’t made the picture any clearer.
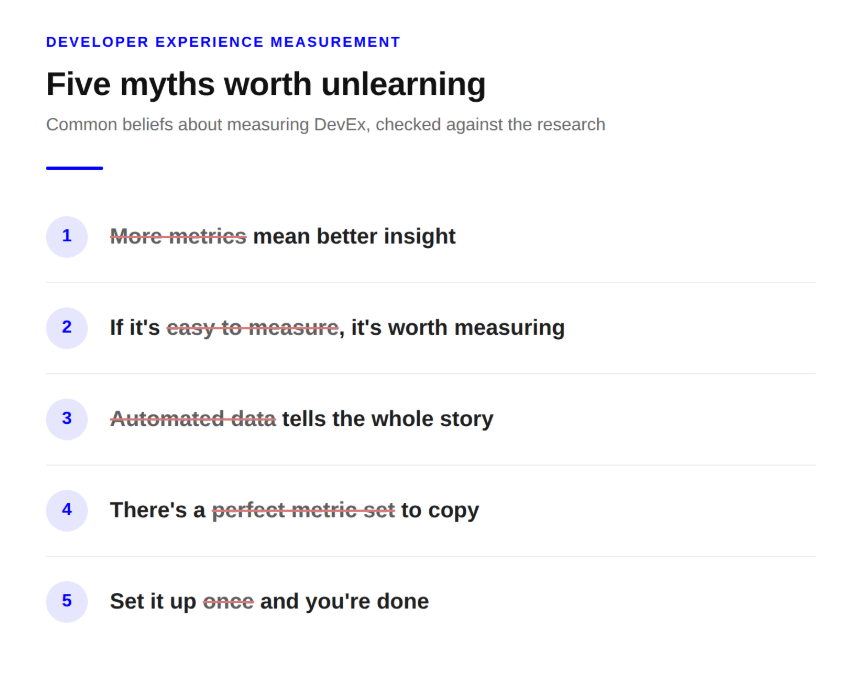
These aren’t tooling problems, they’re beliefs about measurement that sound reasonable and quietly steer teams wrong. When I introduced the DevEx Metrics Compass in my last post, I mentioned them only in passing. This post is about the top five myths that teams trip over most often.
Let’s dig in …
Myth 1: More metrics mean better insight.
The instinct, especially once AI is in the picture and leadership wants answers, is to measure more. Adoption rates, percentage of AI-written code, token spend, throughput. But metrics without a hypothesis behind them don’t add insight. They add noise. Engineering teams already sit on mountains of data (commits, PRs, build times), and none of it tells you whether developers are productive, satisfied, or quietly burning out.
The opposite failure is just as common: anchoring on a single number, like PR throughput, and treating it as the whole picture. Neither works. The fix isn’t the “right” single metric or an ever-growing pile of them, it’s starting from the problem you’re trying to solve, forming a hypothesis, and picking the few metrics that let you monitor both your status quo and the impact of a specific change. The hard part is deliberate selection, not accumulation.
Myth 2: If it’s easy to measure, it’s worth measuring.
Automated metrics (commit counts, lines of code, token spend) are abundant and cheap, so they dominate. In our dataset, 72% of metrics are collected via automated instrumentation. But cheap-to-collect and worth-collecting aren’t the same thing. High commit counts don’t mean developers are working on the right things, and these numbers are trivially easy to game: split PRs, inflate commit counts, write more code that delivers no more value.
Worse, the dimensions most tied to sustainable productivity, developer enablement and team dynamics, are exactly the ones that can’t be captured automatically. Cognitive load, collaboration quality, autonomy, focus: these need surveys or interviews. So teams end up measuring what’s easy and missing what matters. This is also, not coincidentally, an output-over-outcomes trap: it’s far easier to count what developers produce than to measure whether the conditions around them let them do great work.
Myth 3: Automated data tells the whole story.
Logs and telemetry are great at tracking what changed over time. They’re (usually) almost useless at explaining why. A drop in deployment frequency after a platform migration might mean delivery slowed, or it might just mean you consolidated services. The number alone can’t tell you.
The most convincing evidence here isn’t an argument, it’s an observation: Google and Microsoft, with mature DevEx data pipelines and no shortage of telemetry, still run structured developer surveys. They don’t do this instead of quantitative measurement, they do it because automated data alone doesn’t explain the numbers. If the “surveys are too subjective” objection held up, these would be the last two companies you’d expect to invest in them. Self-reported data is what makes the quantitative patterns interpretable, and points toward what to actually do about them.
Myth 4: There’s a perfect metric set to copy.
It’s tempting to lift a metric set from a well-known engineering blog, adopt a popular framework wholesale, or replicate what a high-profile company does. As one senior engineering leader I’ve recently spoken to put it: “There is no universal set of metrics that solves every business’s problems. What works depends entirely on your tooling, team structure, and situation.”
Metrics have to be tailored to your context, goals, and improvement hypotheses. And context shapes interpretation as much as selection: the same metric can mean completely different things after a reorganization, a migration, or a change in team composition. A deployment-frequency target that was sensible for a monolith can become meaningless after a move to microservices. Borrowed sets rarely survive contact with a different environment.
Borrowed sets rarely transfer to your context, objectives and measurement maturity. Don’t copy a peer’s metrics; compare yours against theirs, or a framework, to spot gaps in what you measure, which is what the Compass’s comparison view is for.
Myth 5: Set it up once and you’re done.
Measurement isn’t a project you finish, it’s a living practice you develop. Left unattended, a metrics collection only ever grows: every new initiative bolts on another measure, dashboards fill up, and the signal-to-noise ratio drops until nobody trusts or reads any of it. Two of the numbers end up contradicting each other and no one remembers what half of them were for.
The moment a metric becomes a target, developers rationally optimize for the number rather than the goal, Goodhart’s law in practice, and the moment people suspect metrics are being used to rank them, honest signal dries up. A healthy practice prunes as deliberately as it adds: every metric earns its place by mapping to a real friction or outcome, has an owner, keeps qualitative and quantitative in balance, and gets retired when it stops informing decisions. Measurement is there to understand the work, not to score the people doing it.
So where does that leave you?
Underneath all five myths is the same idea: the goal isn’t to measure more, it’s to measure deliberately. Define what you actually need to know, pick the few metrics (automated and self-reported) that tell you whether you’re moving toward it, and establish a baseline before you intervene, not after. A metric measured only after an AI rollout can’t tell you whether it changed anything, much like bloodwork taken after you already feel sick can’t tell you what healthy looked like.
As AI takes over more of the mechanical work of writing code, the human experience around it, collaboration, cognitive load, autonomy, only gets more important. Those are exactly the dimensions output-focused numbers will never surface.
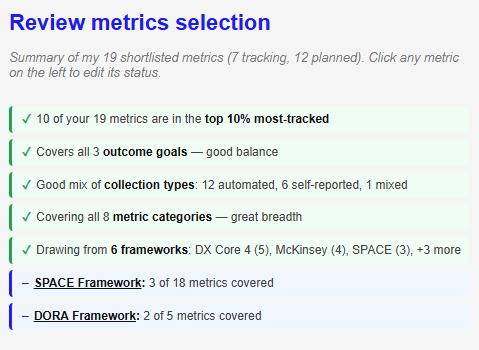
The DevEx Metrics Compass was built for exactly this. You can explore the full landscape of 120+ metrics and surface ones you’re not yet tracking, benchmark your setup against frameworks like DORA, SPACE, and DX Core 4 or against peer companies to see what you’re missing, and review your current and planned selection for coverage, balance, and gaps, before you commit to instrumenting anything.
Learn more …
- Read the ACM Queue Article: devexcompass.com/paper
- Try the Compass: devexcompass.com
- The Compass is open source; contributions, new metrics, and company data points are welcome on GitHub.
The Compass was created in collaboration with Gail Murphy, Thomas Fritz, and Patrick Meyer.